  |
Figure 1 - The spectrum of visible light |
Auroral colors, typically a greenish-yellow and/or red, are caused by high energy particles colliding with various layers of atmosphere that contain differing percentages of oxygen and nitrogen:
When excited by high energy particles, elements emit light in the visual spectrum:
| 400 | 500 | 600 | 700 | nm |
|
Figure 1 - The spectrum of visible light |
When exposed to a weak beam of high energy particles, electrons around oxygen and nitrogen atoms are excited one energy level and they emit red light. When hit by higher energy beams, oxygen is excited two energy levels and emits greenish-yellow light at 558nm. Weakly excited nitrogen also emits green light. When strongly excited, the nitrogen2 molecule emits a strong red light at 630nm and between 650-680nm. Secondary resonance excitation of nitrogen2 weakly emits blue-purple light (at 391nm and 428nm).


Grey aurora are also aurora colored green, red and/or blue-purple. They are either so far away or so faint that they do not trigger the color receptors in your eye. So you see them in black and white.
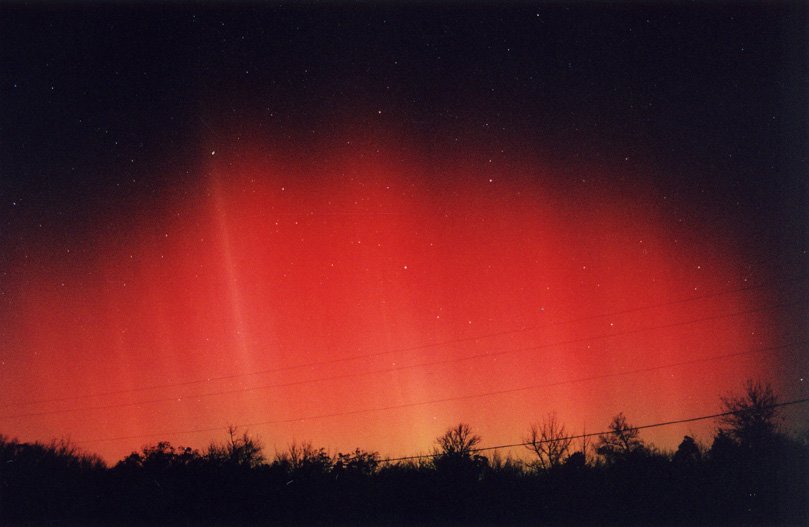
A homogeneous but relatively weak beam of high energy particles penetrates the upper 500km+ layer dominated by H, He and O. Oxygen is weakly excited. A red sky glow results.

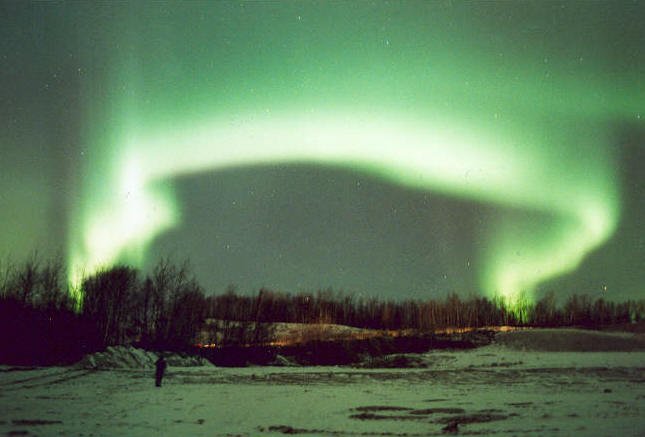
A homogeneous higher energy stream penetrates to the 100-200km layer. Oxygen becomes highly excited and its emissions dominate over nitrogen.

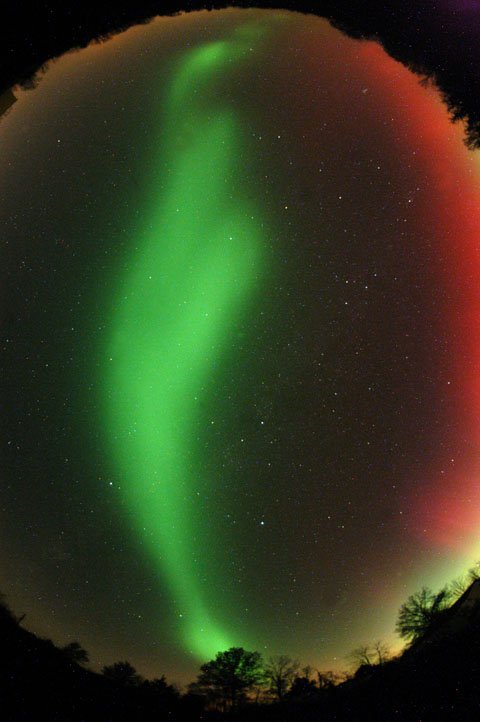
A mixed stream of particles consisting of some high energy and some relatively weaker energy particles penetrates the atmosphere. The higher energy particles reach the lower 100-200km layer. The weaker beam only penetrates higher layers of the atmosphere. A Type C color all-green aurora is produced in the lower layer, a Type D all-red color aurora is produced higher up.

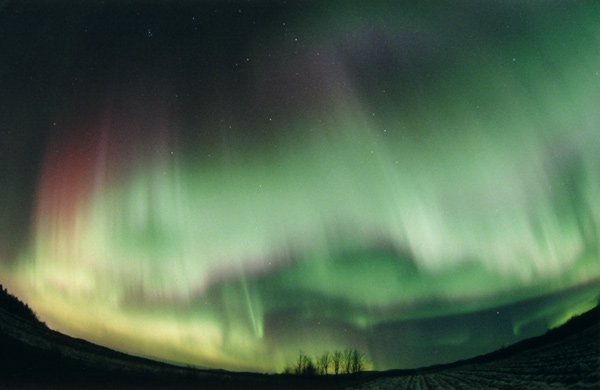

A very high energy beam penetrates the lowest layer of the atmosphere below 100km, to perhaps as low as 70km. Above 100km a Type C all-green aurora is created. Below 100km, nitrogen2 is the dominate gas. When excited, the nitrogen molecules emit red light.
Color Type E is simply a Type B aurora where the colors are rapidly moving along the horizon. The very same high energy streams that penetrate the lowest level of the earth's atmosphere and cause Type B aurora, can also generate "walking flames" of red and green color.
These colors are typically seen in twilight skies at sunrise and sunset. They result from an secondary excitation of nitrogen molecules. The incoming high-energy particles ionize nitrogen molecules. Then the low-angle sunlight in the evening or morning twilight further excites the ionized nitrogen molecules and those molecules emit a blue-purple light.
As noted above, grey aurora have color. They are either so far away or so faint that they do not trigger the color receptors in your eye.
A physical taxonomy for visual aurora observers was developed during the 1957-1958 International Geophysical Year. The appearance of homogenous or rayed arcs depends on your angle of observation. The same arc appears different if the observer sees it from a side angle, from nearly underneath and from directly underneath.

A steady spot or patch.
These waves look like airport light beacons sweeping across the sky. They can precede a Type A-D auroral display.
The International Brightness Coefficient (IBC) can be used to describe the brightness of aurora. Davis (1992). It is hard to judge what the actual brightness is of auroras seen in web posted photographs, considering differing and unknown photographic exposure times.

A narrative from an 10/2003 auroral display seen at 41N:
The entire display lasted about one hour. The main auroral display was preceded by pluses of white fast auroral waves on the northern horizon. Then patches of red and green where seen. These expanded into area of red and green sky glow covering most of the northern horizon. Green drapery formed. These intensified to green with red top Type A aurora. As the display reached its peak, rayed arcs showing green, yellow and red streaking appeared. The following photo was taken at that time:
Kurt Fisher 10/29/2003 Salt Lake City, UtahThe start to the peak of the display lasted about 45 mins. The display receded abruptly. The Type A drapery appeared to walk from west to east, dissipating in the west first, then dissolving into red and green sky glow on the northwestern to western horizon.
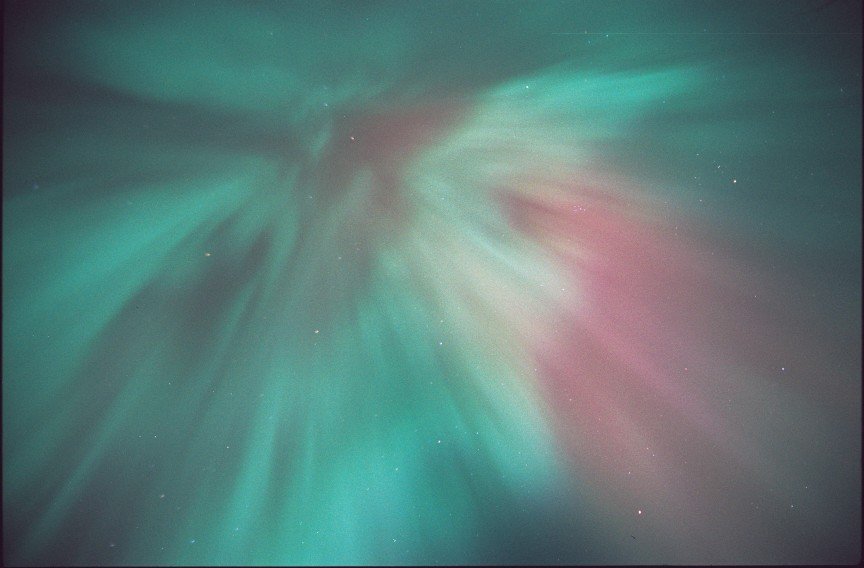
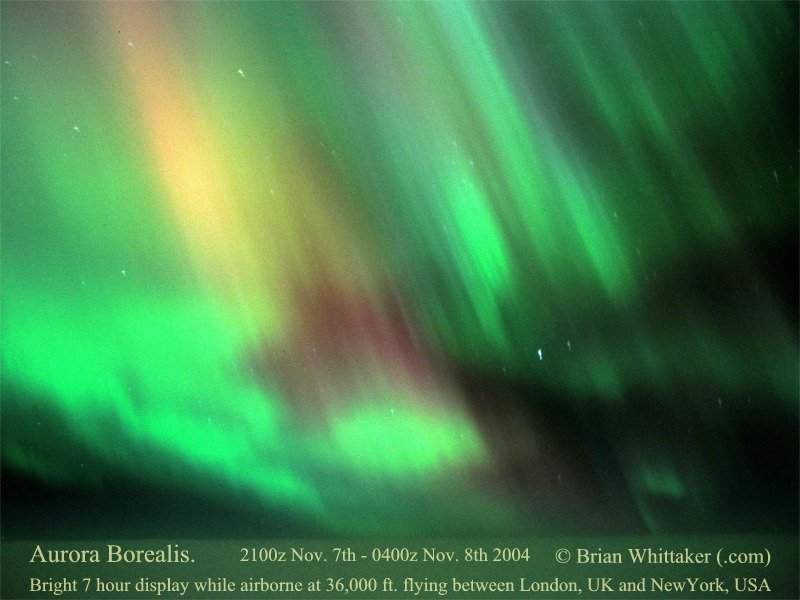
A series of photographs from a November 8, 2004 geomagnetic storm caused by Sunspot 696, illustrate ray angles.


The rays' angle corresponds to the observer's latitude.
The energy that causes auroras follows the lines of force in the earth's magnetic field. Davis (1992).

The angle between these force lines in the earth's magnetosphere and the local horizon varies with latitude. The local lines of geomagnetic force in the earth's magnetosphere can be traced between the observer's local geomagnetic zenith and the earth's center. The geomagnetic zenith is a point south of the observer's local zenith.
Table 1 gives the rough guidelines for the angle between the observer's local zenith and observer's geomagnetic zenith. The auroral rays run parallel to this angle, as they the follow the geomagnetic lines of force:
| Latitude | Angle zenith-geomagnetic zenith |
| 90 (North Pole) | 0 |
| 80 | 5 |
| 70 | 12 |
| 60 | 20 |
| 50 | 28 |
| 40 | 37 |
| 30 | 45 |
| 20 | 60 |
| 10 | 75 |
| 0 | 90 |
Rough distance estimates can be made based on the simplifying assumption that the bottoms of green Type C auroras and the bottoms of green (with red top) Type A auroras are 100 kilometers above the earth's surface. The bottoms of all red auroras are assumed to be 250 kilometers above the earth's surface. Davis (1992).
Measure the angle between the horizon and bottom of the aurora. The following tables, that apply basic trigonometry, can be used to roughly estimate the horizontal distance to a point directly underneath the aurora:
| Angle horizon to bottom of aurora | Horizontal distance to aurora (kilometers) | Assumed vertical distance (km) |
| 0 | 1100 | 100 |
| 10 | 450 | 100 |
| 20 | 250 | 100 |
| 30 | 170 | 100 |
| 45 | 100 | 100 |
| 60 | 60 | 100 |
| 70 | 40 | 100 |
| 80 | 20 | 100 |
| 90 | 0 | 100 |
| Angle horizon to bottom of aurora | Horizontal distance to aurora (kilometers) | Assumed vertical distance (km) |
| 0 | 1800 | 250 |
| 10 | 1000 | 250 |
| 20 | 600 | 250 |
| 30 | 400 | 250 |
| 45 | 250 | 250 |
| 60 | 120 | 250 |
| 70 | 80 | 250 |
| 80 | 40 | 250 |
| 90 | 0 | 250 |
The angle from the horizon to the bottom of an aurora can be estimated with an outstretched arm and your hand. Clench your fingers and give the "thumbs" up sign. Davis (1992). The angular distance is between 18-20°. 4 1/2 "hands" counts off 90°.
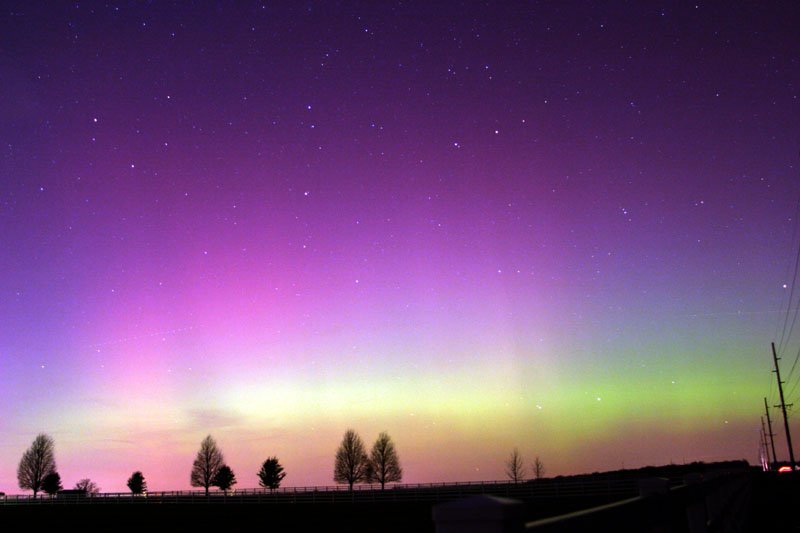
Estimating a 10° angle from Mike Hollingshead's northeast looking picture taken on the evening of Nov. 8, 2004 from Lat. 41°N in Nebraska, USA., -

the auroras in the photograph would have been over Minneapolis, Minnesota, which is about 450 km (280 miles) to the northeast.
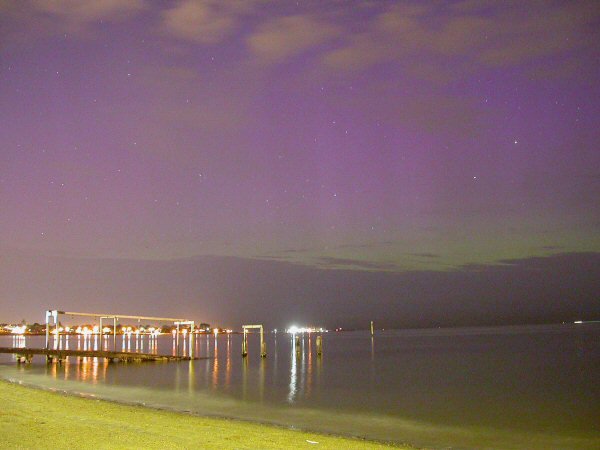
Another picture, reported at www.Spaceweather.com, was taken on the Nov. 8, 2004, by Abe Megahed, from downtown Madison, Wisconsin. -
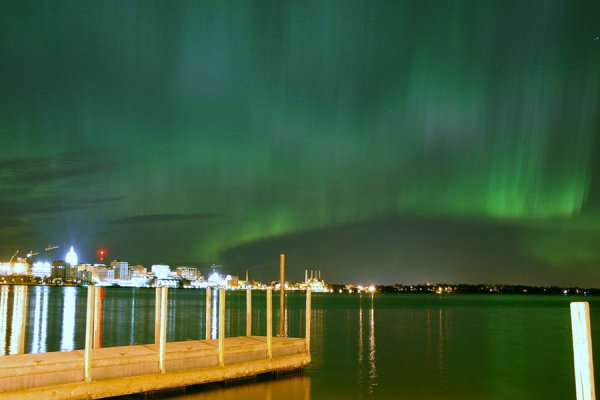
Like Minneapolis, Madison, Wisconsin is nearly on a 450 km (280 mile) radius from Hollingshead's observing point in Nebraska. it is possible that Megahed's picture is the same auroral display that Hollingshead was looking at, only from directly viewed from underneath the auroral drapery.
A U.S. Department of Defense satellite photograph of the geomagnetic storm, published on SpaceWeather.com, confirms that auroral drapery were over Minneapolis, Minnesota and Madison, Wisconsin on Nov. 8, 2004:
References:
Davis, Neil. 1992. The Aurora Watcher's Handbook. Univ. of Alaska Press.
RASC. 2005. Observer's Handbook. p. 108.